A SCUBA SUB-MM SURVEY OF THE GALACTIC CENTRE
D. Pierce-Price, J.S. Richer (MRAO), J.S. Greaves, W.S. Holland,
T. Jenness (JAC), A.N. Lasenby (MRAO), H.E. Matthews (JAC), G.J. White
(QMW), D. Ward-Thompson (Cardiff), W.R.F. Dent (UK ATC), R. Zylka, P. Mezger
(MPIfR Bonn), T. Hasegawa and T. Oka (Tokyo)

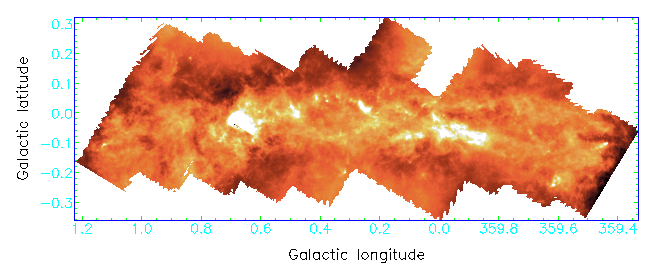
This figure shows part of a submillimetre continuum survey of the Galactic
Centre, made with SCUBA on the JCMT. SCUBA's on-the-fly scan-map mode has
allowed us to make extremely wide-field maps of thermal dust emission with
unprecedented speed and sensitivity. The Galactic Centre is of great interest,
being both an extreme region of our own galaxy - containing much active
star formation - and the nearest example of a galactic nucleus.
Our ultimate aim is to map as much as possible of the `Central Molecular
Zone', which contains up to 10% of the Galaxy's molecular ISM. Thermal
dust continuum emission allows us to make an unbiased map of the temperature
weighted column-density of material, and hence derive the total masses
of the molecular clouds, find regions of star formation, and investigate
cloud structures.
This new survey covers a significantly greater area than previous maps
(cf. the 800 micron map made at the CSO by Lis & Carlstrom 1994, ApJ,
424:189-199) and we are also able to make spectral index maps using the
simultaneously observed 450 micron and 850 micron data.
The current reduced map has a total size of approximately 100 x 30 arcmin.
It covers the SgrA region - including SgrA*, the circumnuclear disc, and
the 20km/s and 50km/s clouds; the area around the Pistol; SgrB2 - the brightest
feature on the map; and at its Galactic Eastern and Western edges, the
Sgr D and Sgr C regions. The images reveal many rich, striking features
such as filaments and shell-like structures, as well as point sources such
as SgrA* itself and a set of methanol maser sites.
The survey has resolutions of 8 arcsec at 450 micron and 14 arcsec at
850 microns, corresponding to distances of 0.33 pc and 0.58 pc at a distance
of 8.5 kpc. The sensitivities per beam are approximately 30 mJy and 300
mJy at 850 and 450 microns respectively, or ~3 Msuns per beam.
The total mass detected in the current region is 1 x 10⁷ Msun,
assuming a dust temperature of 30 K.
We have derived fluxes and mass estimates for the prominent features
in the survey area, and have used the 450 and 850 micron data to produce
a spectral index map, and hence a point-to-point map of the dust opacity
index (assuming knowledge of the dust temperature). For example, assuming
a dust temperature of 30K, we estimate the masses of the 20km/s and 50km/s
clouds (M-0.13-0.08 and M-0.02-0.07, near SgrA) as 150,000 Msun
and 80,000 Msun respectively. The total mass in the vicinity
of these two clouds is ~500,000 Msun.
The maps have also been used to calculate sub-millimetre fluxes of the
point-source SgrA*, complementing SCUBA polarimeter jiggle-map observations
of the same source. The 450-2000 micron spectrum of SgrA*, together with
its polarisation, is discussed by Aitken et al. (ApJL, submitted).
We have also investigated many issues related to the reduction of SCUBA
scan-map data. As scan-map is a relatively new observing mode for SCUBA,
its data reduction - particularly for wide-field mosaiced surveys - has
presented some problems. Due to chopping of the JCMT secondary mirror,
scan-maps produce dual-beam convolved images with no spatial-frequency
information at the inverse chop throw and its harmonics. The total power
level is also not observed. To improve coverage in frequency space we have
used the `Emerson 2' algorithm (Jenness et al. Proc SPIE 3357, 548, 1998),
combining observations made of the same field using different chop throws
and orthogonal chop position angles.
Many of the difficulties of scan-map reduction have now been solved,
including uncertainties about how to mosaic many multiple fields. Furthermore,
many scan maps previously had unphysical negative holes around regions
of bright emission (with depths ~10-20% of the peak object brightness).
Standard baselining tended to overestimate the zero-level on individual
scans which observed mostly bright emission, thus producing negative artefacts
after baseline removal. With more careful baselining, considering entire
observations rather than individual scans, we have succeeded in essentially
eliminating these artefacts.
Back
to: The JCMT Newsletter Index